
Demographic Reports
Who a campaign actually reached, available without measurement
Demographic reporting describes who a campaign reached, as opposed to what they did about it. It profiles the devices observed in the campaign's viewsheds and compares that profile against the national population.
It is the one report that does not depend on measurement.
Always PopulatedDemographic reporting is derived from exposure alone. Any Campaign with an associated Source gets it - no Study, no conversion properties, and no waiting for a campaign to end. If measurement was never requested, this is still available.
That makes it useful in situations where a lift study is not: campaigns too small to measure conclusively, campaigns where no conversion environment could be configured in time, and mid-flight checks on whether a buy is landing against the intended audience while there is still time to change it.
What It Reports
Headline Metrics
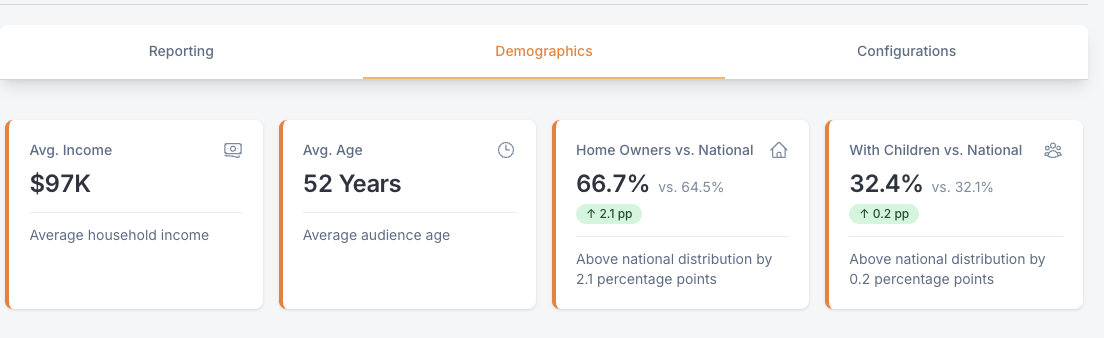
Summary statistics about the exposed audience (average age, income, proportion that are homeowners) are displayed at the top of the report
Audience Composition
The exposed audience is broken into categories, each rendered as its own panel:
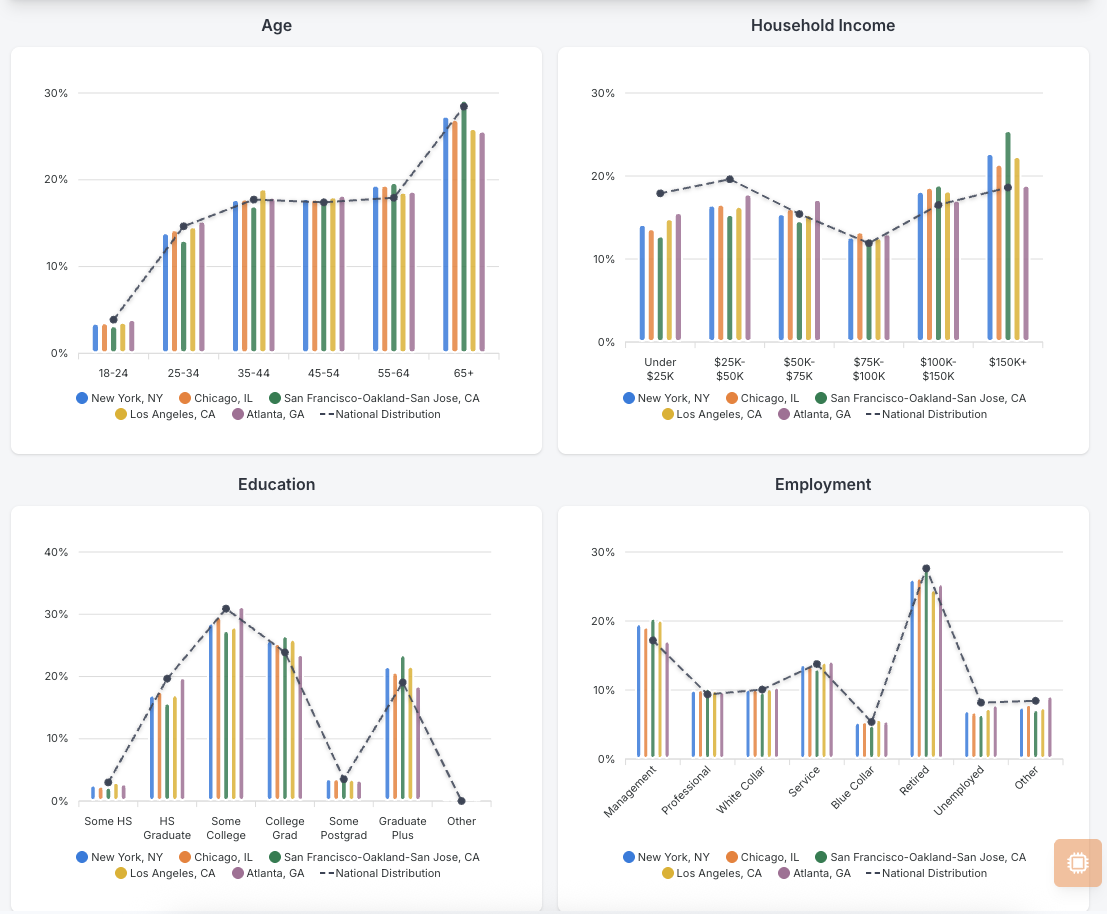
These are the distributions of the exposed audience across various demographic categories. The supported categories are:
- Age
- Household Income
- Education
- Employment
- Urbanicity - the density of the areas the audience lives in
- Tech Use
This Describes Who Was Reached, Not Who ConvertedDemographic reporting profiles the exposed group. It says nothing about which of those people converted - that is what an Incremental Lift Report answers. A campaign can reach precisely the intended audience and still show no lift, and the two reports together are what distinguishes a targeting problem from a creative one.
Demographics Are Household-Level
Every figure on this report describes the head of household associated with a device, not the individual holding it.
Demographic attributes are not observed directly - a device emits location data, not an age. They are attached by matching the device to a household and taking that household's characteristics. The person carrying the phone may be a teenager, a housemate, or a partner, but the age, income, education, and employment reported are the head of household's.
Expect a Skew Older and Higher-IncomeBecause heads of household are on average older and earn more than the population at large, these distributions sit above an individual-level profile of the same audience. A campaign that genuinely reached a lot of 22-year-olds will still report meaningful weight in older brackets, and household income will read higher than those individuals personally earn.
This is a property of the measurement, not a finding about the campaign.
The practical consequence is about what you compare against.
- Against the national baseline on this report - reliable. Both sides are built on the same household basis, so the over- and under-indexing is a like-for-like comparison. This is the reading to trust.
- Against an individual-level source - not comparable. Survey panels, self-reported registration data, and person-level DSP segments describe individuals. Placing those numbers beside these will show a systematic gap in age and income that is an artefact of the two bases, not a disagreement about the audience.
So read the index rather than the absolute level whenever the comparison crosses outside this report. A bracket sitting 11 points above national means the same thing regardless of the basis; "34% of the audience earns over X" does not.
Comparison Against National
Every figure is shown against the national distribution, expressed as a difference in percentage points. A campaign whose audience is 8 points above national for a given income band over-indexes there; one that matches national is described as such.
This comparison is what makes the numbers actionable. Knowing that 34% of a reached audience falls in a given bracket means little on its own. Knowing it is 11 points above the national rate says the buy is doing something.
Cuts and Filters
The report can be broken out by cut, most commonly by market, letting you compare the audience reached in one market against another or against the campaign overall. The unfiltered view is the campaign-wide aggregate.
Selecting a cut redraws every panel, so the national comparison is recomputed for that subgroup rather than carried over from the total.
Reading It Well
Over-indexing is relative, not absolute. A category can be a small share of the audience and still be the campaign's strongest signal, if it is far above national. Read the comparison, not just the percentage.
Small cuts move more. A single-market cut is drawn from fewer devices than the campaign total, so its profile is noisier. Treat a dramatic-looking skew in a small market with more caution than the same skew campaign-wide.
The panel is a sample. As with all Mira measurement, this profiles the devices observed rather than everyone who passed the inventory. It is representative rather than a census.
Exporting
Demographic reporting exports to a slide deck, either on its own or as part of a fuller campaign deck. A Campaign with no measurement Study produces a demographics-only deck.
Updated about 2 months ago