
Incremental Lift Reports
What the Console shows for a measurement Study
The incremental lift report is what a measurement Study produces. It lives on the Campaign's reporting tab and appears once the Study begins computing.
This page covers what is on the screen and where each piece comes from. For the methodology behind the numbers, see Incremental Lift.
When It Appears
Reporting is populated while the Study is IN_PROGRESS rather than at the end, and refreshes as exposure and conversion data lands. It stops changing when the Study is marked DELIVERED. See Configuring Measurement Studies for the status values.
Two consequences follow from that:
- Early figures are volatile. A Study read a few days in is working from a fraction of the data it will eventually have, and small samples move. Nothing is wrong; there is simply less of it.
- A Study with a control may report in stages. The exposed-group figures can be available before the control-based metrics are, so a report showing conversion rates but no net lift is mid-computation rather than misconfigured.
What Is On the Report
Headline Metrics
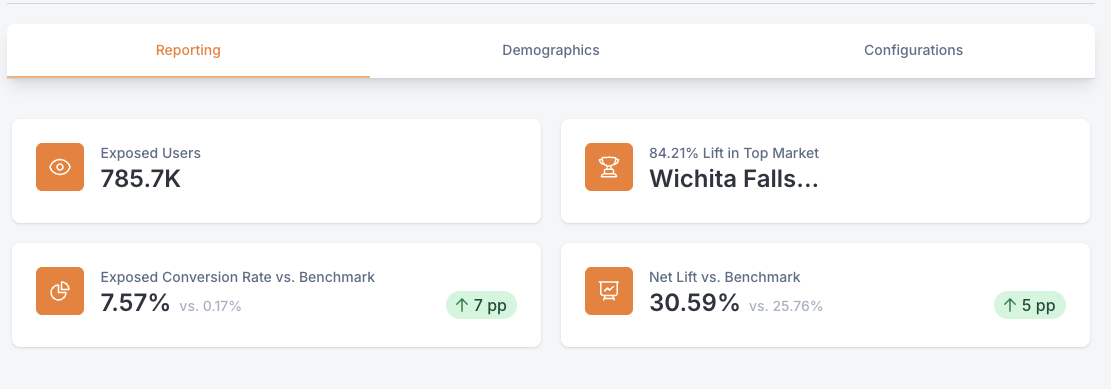
The top of the report carries the Study's summary figures: net lift, the confidence interval around it, and the sample sizes behind each group. Where a benchmark exists for the Campaign's vertical and property type, it appears alongside as a comparison badge.
A benchmark is a reference drawn from comparable past studies. It answers "is this good?" in a way an isolated lift figure cannot, and it is matched on vertical and conversion type so the comparison is against like campaigns.
Overall Rates
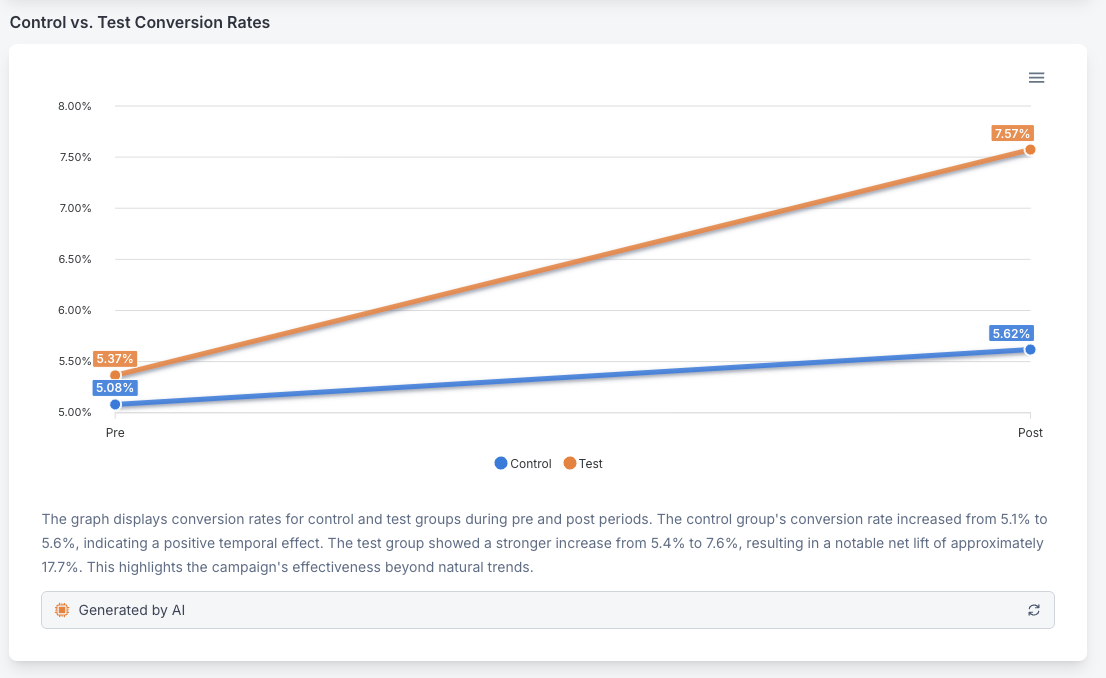
A line chart showing each group's conversion rate in the pre and post periods - control in one series, exposed in the other.
Read it left to right. The two lines should start close together in the pre period, because neither group has been exposed yet; that is the evidence the control is a fair comparison. The exposed line pulling away in the post period is the shape a working campaign produces.
A Study configured without a pre period will show post-period values only.
Lift Charts
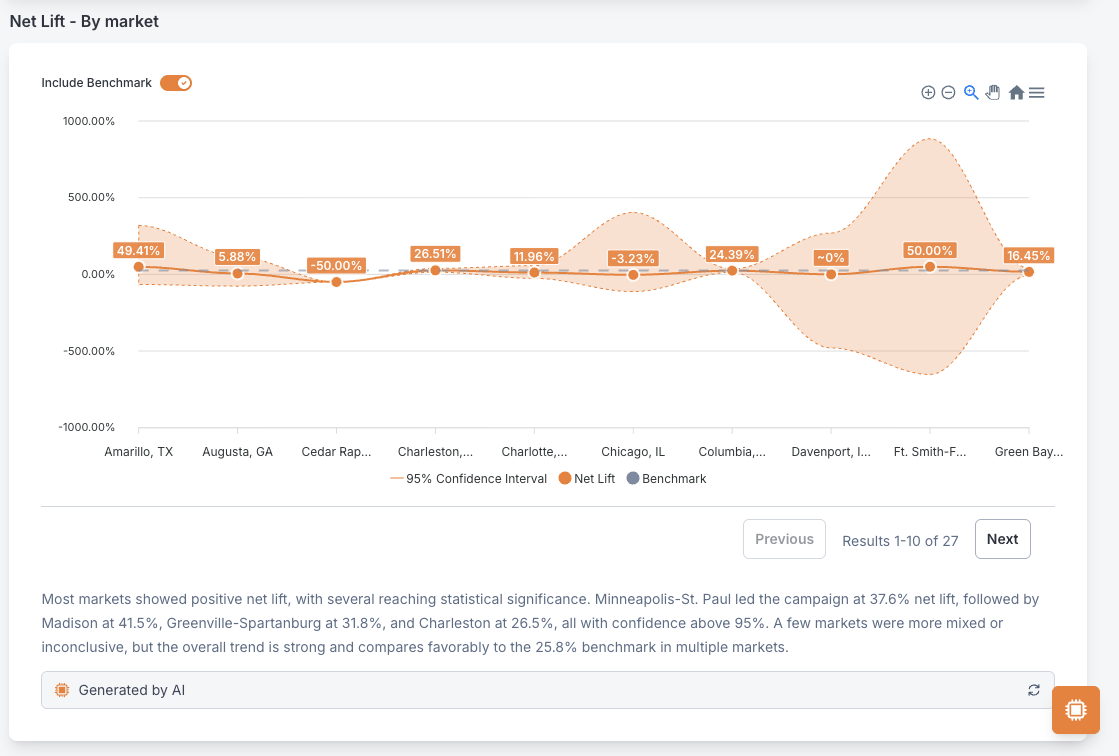
A line chart with the observed lifts and confidence intervals around them. The lift displayed depends on what the study is configured for and whether the control has been processed (if requested).
| Has Control | Has Pre | Metric Displayed |
|---|---|---|
| yes | yes | Net Lift |
| yes | no | Post Lift |
| no | yes | Exposed (Test) Lift |
| no | no | Exposed Conversion Rate |
Cuts
Where the Study requested cuts, each subgroup gets its own row of figures and can be selected to redraw the charts. Market of exposure, property, and goal are always present; anything else was requested at configuration time and had to be available in the source data.
Cuts Will Not Add Up to the TotalConversion rates count unique users, and a user can fall into more than one subgroup - someone exposed in two markets appears in both. Subgroup figures therefore do not sum to the overall figure, and should not be reconciled against it.
Cuts also carry smaller samples than the overall result, so their intervals are wider. An overall result that reaches significance while its cuts do not is the expected pattern, not a contradiction.
Exporting
Any report can be exported as a slide deck for sharing outside the Console. The deck carries the same charts and figures, with AI-written captions where they are enabled.
What To Check First
When a report does not look how you expect, these account for most cases:
- Charts are empty. The Study may not have started computing yet, or no conversion data has arrived. Check the Study status and Understanding Goal Health.
- A cut you asked for is missing. The field has to be present in the exposure data. A cut requested on a field the vendor never supplied cannot be produced after the fact.
- The pre period looks short. Pre period length is derived from the attribution window, then trimmed to the conversion data actually available. A pixel that went live close to the campaign start will shorten it.
- Sample sizes look small against the media plan. Expected. Impressions count viewing opportunities; a Study counts unique people, and Mira observes a sample of the population. See the FAQ.
Updated about 2 months ago